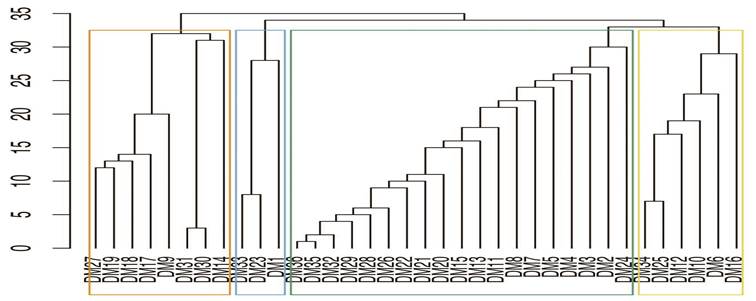
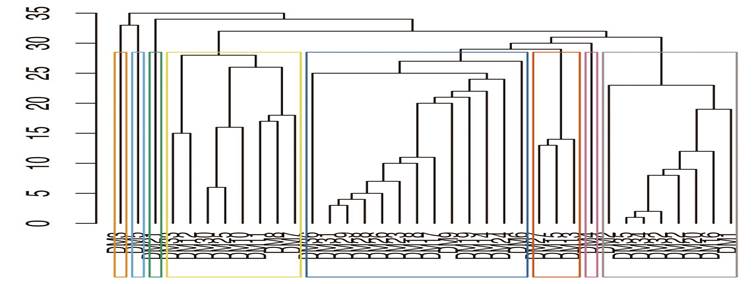
(a)
Correlation coefficients plot: individual
opinions for the three main constructs.
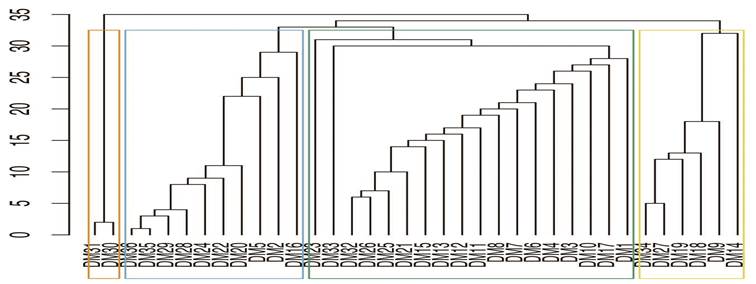
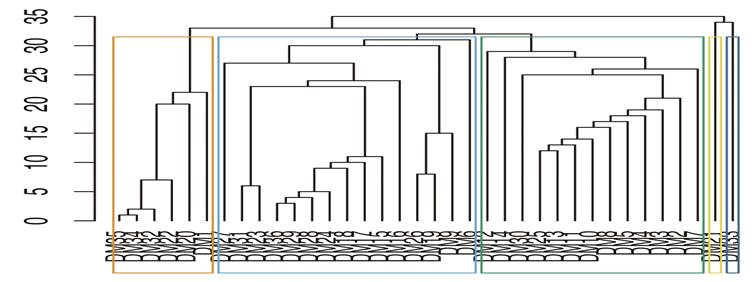
(b)
Cosine Similarities Plot –
Individual Opinions for the 3 Main Constructs
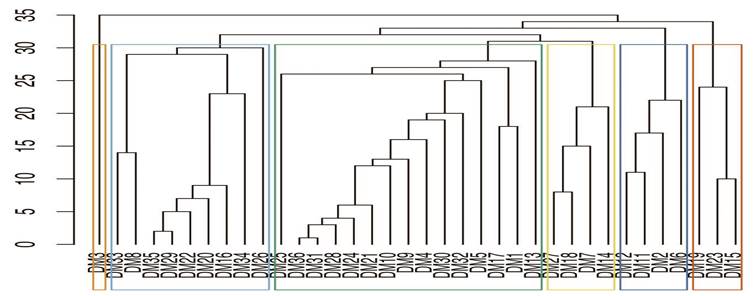
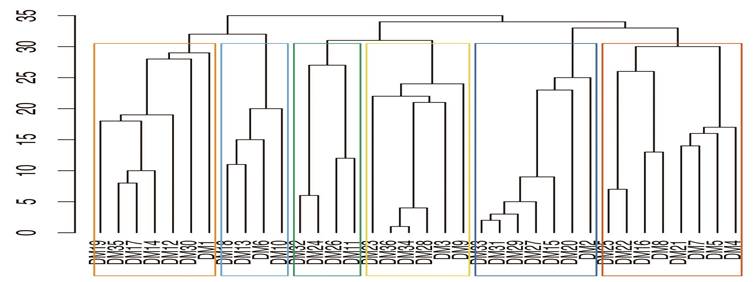
(c)
Correlation coefficients plot: individual
opinions for the four factors with respect to price (CA).
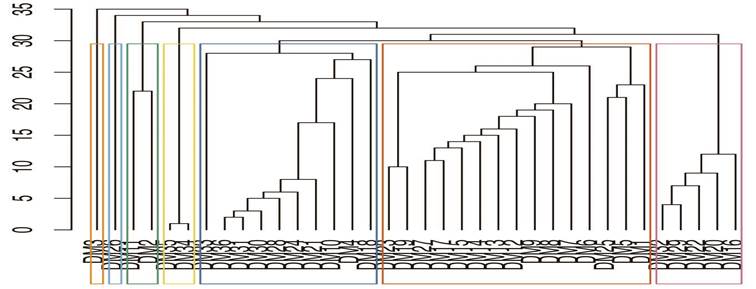
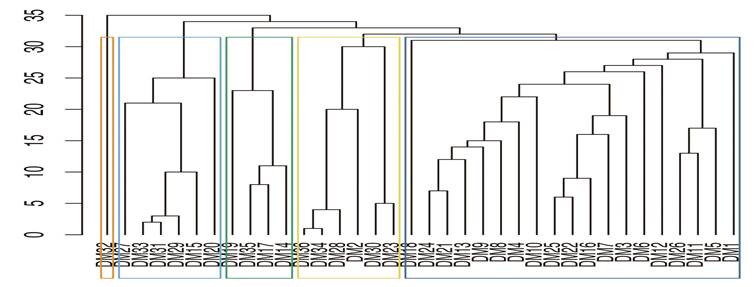
(d)
Cosine similarities plot: individual
opinions for the four factors with respect to price (CA).
(e)
Correlation coefficients plot: individual
opinions for the five factors with respect to location (CB).
(f)
Cosine similarities plot: individual
opinions for the five factors with respect to location (CB).
(g)
Correlation coefficients plot: individual
opinions for the six factors with respect to conditions.
(h)
Cosine similarities plot: individual
opinions for the six factors with respect to conditions (CC).
Figure 6. Decision (classifying) trees.